Independent teaching case. Public records and announcements describe the development. The rent, unit-mix, cost, and loan scenarios are instructional assumptions, not the sponsor’s actual underwriting or financial condition. No owner or investor endorsement is implied.
Locate the redevelopment within the shopping center
Atlas Fullerton (also marketed as Atlas Condesa) is located at 229 East Orangethorpe Avenue, Fullerton, CA, northwest of South Lemon Street and Orangethorpe Avenue in Fullerton Town Center. Costco and AMC are nearby shopping-center landmarks [1, 4, 6].
Aspect · south of the redevelopment
251 Orangefair Avenue, Fullerton. Approximately 0.25 mile from the redevelopment marker. Orangethorpe Avenue and the shopping-center blocks lie between the two sites.
Community location and directions [13]770 South Harbor · northwest
770 S. Harbor Boulevard, Fullerton. Approximately 0.25 mile from the redevelopment marker, near the Harbor Boulevard corridor.
Community location and directions [14]Original neighborhood map using street geometry from OpenStreetMap [15] (© OpenStreetMap contributors). The redevelopment marker is an approximate site location from the city’s site-location exhibits [1]. Community addresses are confirmed on their official websites; Aspect’s point uses its mapped property area and South Harbor’s point uses its official directions link. Distances are straight-line measurements between these reference points, rounded to the nearest 0.05 mile; they are not entrance-to-entrance walking or driving distances. Marker sizes do not represent parcel areas. Map prepared September 24, 2026.
Broker conceptual renderings
Retail Insite markets the property as Atlas Condesa, at 229 East Orangethorpe Avenue, Fullerton. These illustrations show the proposed appearance; they are not photographs of completed construction or a verified final design.
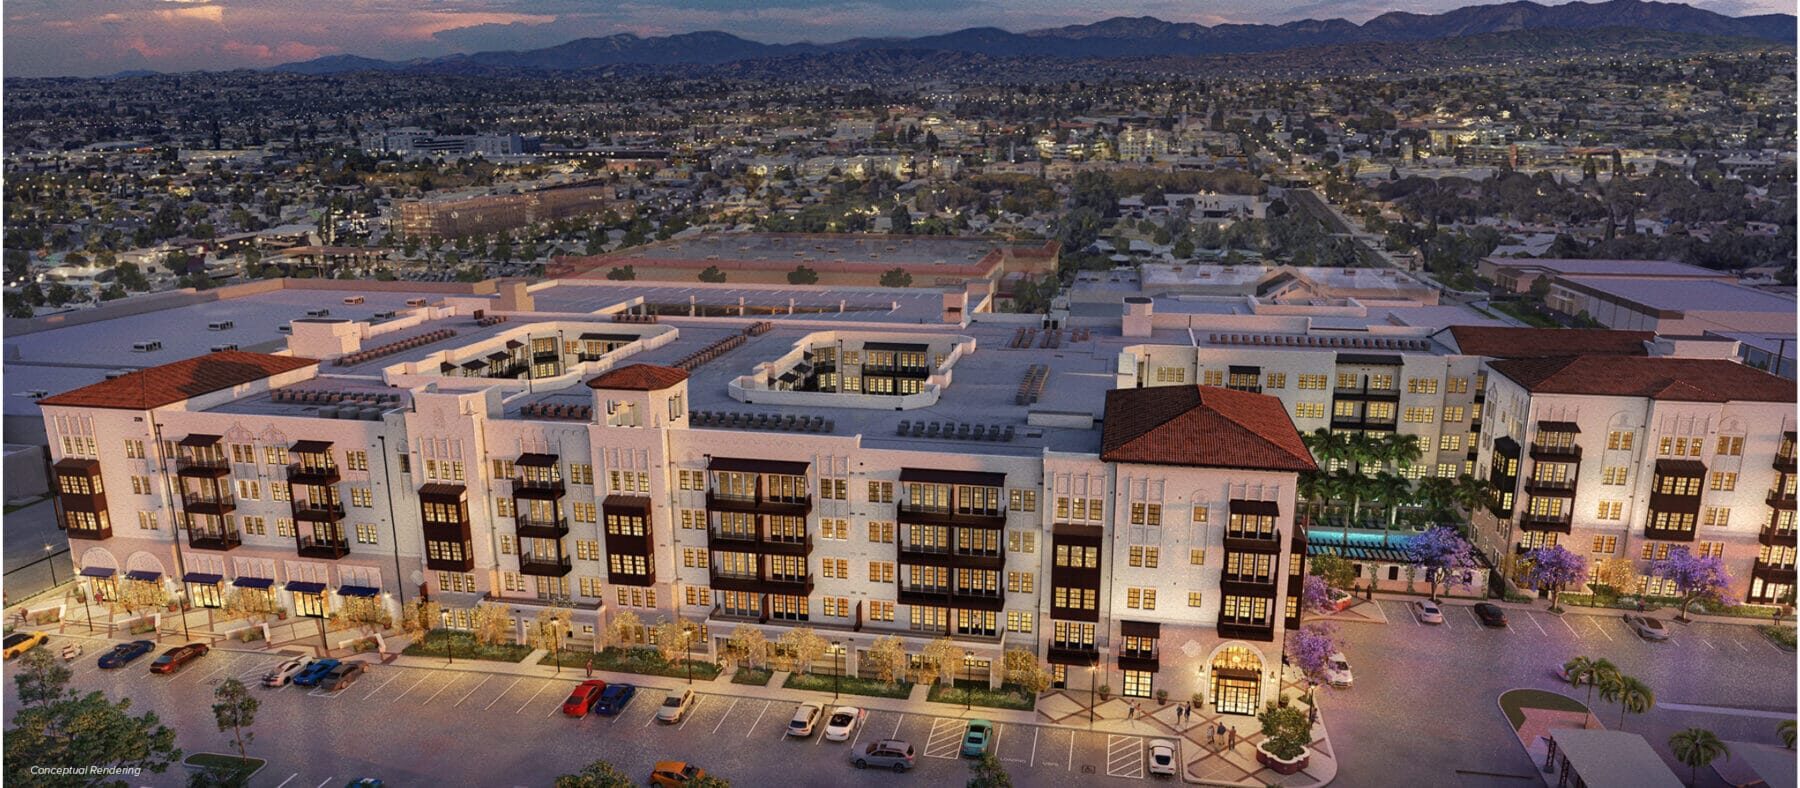
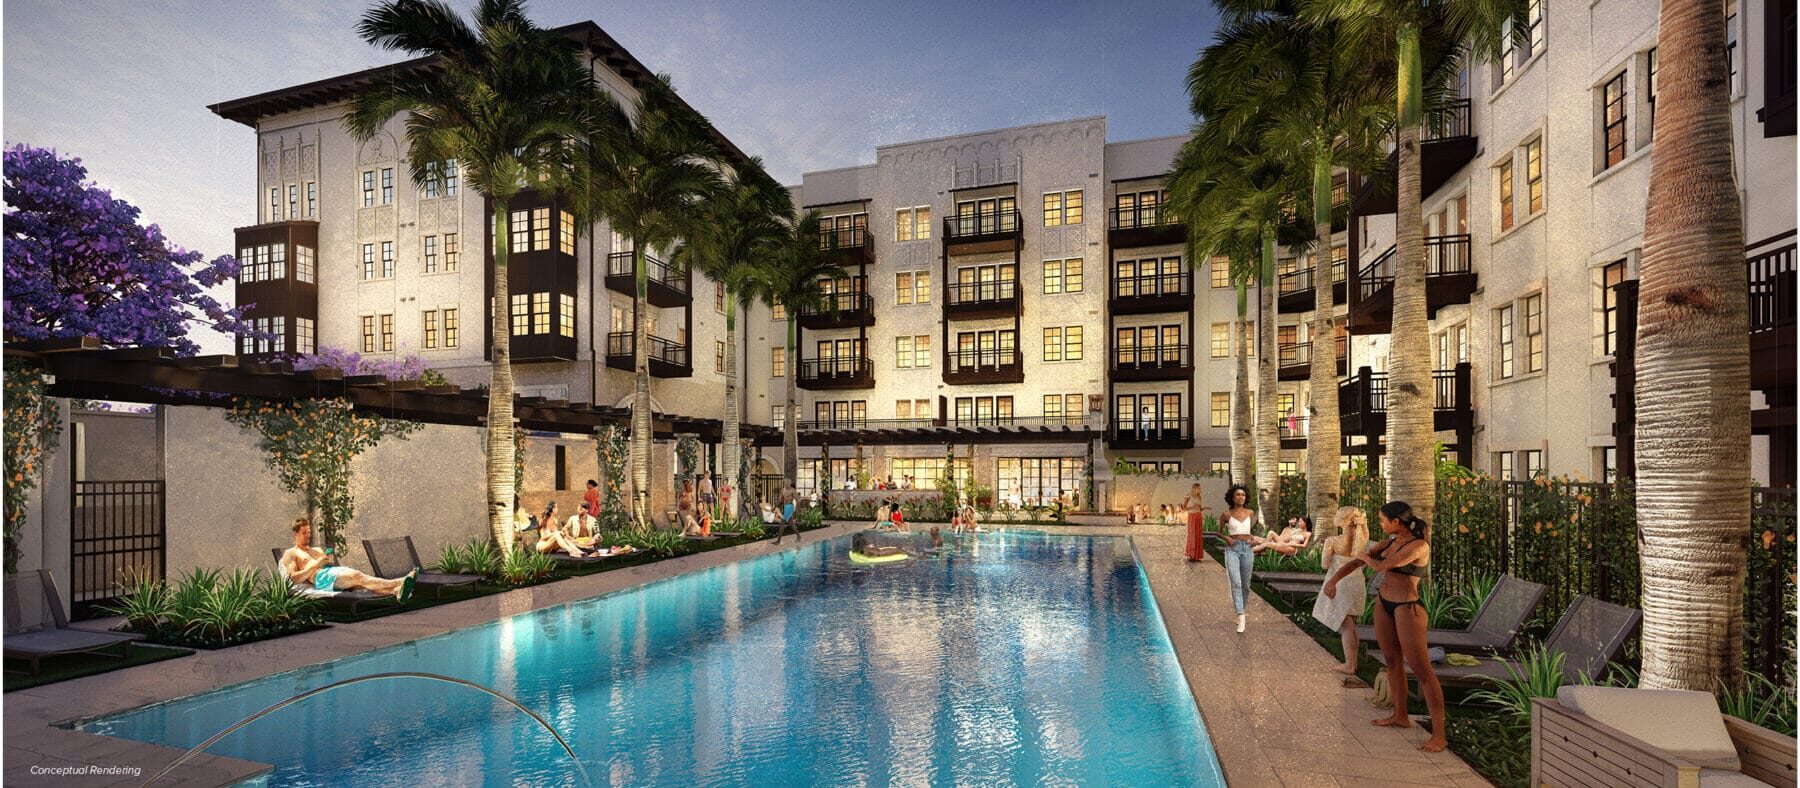
Source: Retail Insite, Atlas Condesa listing [6]. Images retrieved September 27, 2026; the broker labels them “Conceptual Rendering.” Third-party image rights remain with their respective holders; these images are excluded from the course’s reuse licenses. Plans and marketed features may change.
The redevelopment is one part of the shopping center: substantial retail remains to its west, and frontage businesses and parking separate it from Orangethorpe Avenue. Costco is farther north, outside this diagram.
The western retail building and southern commercial sites are shown at approximate proportions drawn from the city’s 2021 site plan, so the redevelopment can be read within the larger shopping center. Gray buildings sit within lighter commercial-site and parking areas. This original diagram simplifies shapes and is not a current aerial map, measured survey, or final floor plan. City Initial Study, Exhibits 1-2 and 3-1 [1]; marketed retail area: broker listing [6]. On a small screen, scroll the diagram horizontally.
How height and FAR reshape the plaza
The redevelopment changes both the use of the land and the scale of the buildings. The city’s inventory describes two one-story commercial buildings, restaurants, and surface parking on the project site. Replacing that setting with a five-story apartment community introduces a much taller, more continuous building presence within the shopping center.
| Measure | 2021 proposal | How to interpret it |
|---|---|---|
| Floor area ratio (FAR) | 1.96 | Total floor area counted under the applicable planning definition ÷ project land area. A FAR of 1.96 means 1.96 SF of counted floor area per 1 SF of land, summed across floors. |
| Residential height | 5 stories; predominantly 65 feet | The study describes towers and other architectural features reaching approximately 85 feet. That is not the height of the entire building. |
| Parking structure | 6 stories | The garage stacks parking vertically. Its level count is separate from the apartment building’s five stories; garage and residential floor-to-floor heights can differ. |
| Residential density | 73.6 homes per acre | 329 homes ÷ 4.47 acres. Density counts homes per unit of land; FAR counts floor area. Larger apartments can increase FAR without increasing the number of homes. |
City Initial Study [1]: existing site and surrounding development, pp. 2-1–2-3; residential height, p. 3-1; parking structure, p. 3-2; reported FAR, pp. 4-74–4-75. These figures describe the 2021 proposal, not verified measurements of the completed buildings. The FAR is reported directly from the study; it is not reconstructed by adding the separately stated residential, retail, and garage areas.
What changes in the plaza—and why it matters financially
The taller building raises the roofline above the former shops and brings a substantial residential population into a setting organized around retail and parking. The plan’s courtyards, stacked parking, and ground-floor retail reorganize how the site is used. From an investment perspective, more usable floor area can spread land cost across more income-producing space, while structured parking, elevators, circulation, and construction complexity add costs.
The comparison is local to the redevelopment site. The city also identified Aspect across Orangethorpe Avenue as an existing community of similar density and scale. The change is substantial within this part of the plaza, while fitting a broader corridor that already includes multifamily housing.
The 4.47-acre project area is approximately 4.5 acres and includes portions of multiple assessor parcels. A project boundary need not match a single tax parcel. The reported $21 million sale concerns the development site, not the entire shopping center [1, 5].
What had to happen before construction could begin?
The project replaces commercial buildings and parking with a five-story apartment community and ground-floor retail. The residential building wraps a parking structure. Existing buildings are being replaced; this is a change in land use rather than the reuse of a store's interior.
Case PRJ2020-00004. The record identifies the original applicant and approvals; the interval before construction does not, by itself, establish a permitting delay. [1, 2, 3, 7]
Who brought the project forward?
| Role | Publicly documented information |
|---|---|
| Original applicant | Streetlights Residential / SLR Fullerton Development LLC [2] |
| Owner in the 2021 filing | PK I Fullerton Town Center LP [2] |
| Reported 2025 seller | BIG Shopping Centers [5] |
| Developer in the 2025 announcement | The Dinerstein Companies [4] |
| Retail leasing broker | Retail Insite [6] |
These sources identify the parties’ reported roles at different dates. They do not establish the current title-holding entity or ownership shares. This case does not present project-specific lender, loan, or investor records.
Read each plan in its time
| Item | How this case treats it |
|---|---|
| 2021 proposal versus later marketing | The initial study analyzes up to 6,500 SF of retail. The later broker listing markets 5,995 SF. Preserve each figure’s date and purpose [1, 6]. |
| Residential mix | The study identifies studios, one-bedroom, and two-bedroom homes. The calculator’s counts and average sizes are independently chosen teaching assumptions, not a verified final unit schedule [1]. |
| Affordable apartments | The initial study specifies 17 very-low-income homes. The final recorded agreement and current rent limits are not reviewed here [1]. |
| Completion | 2027 is an announced target, not evidence of a certificate of occupancy or completed leasing [4]. |
| Financial feasibility | Public project facts establish the setting. The financial scenarios do not disclose actual costs, loan terms, or returns. |
Fewer daily trips can coexist with busier peak hours
The city study compared the proposed development with businesses operating on the site when the study data were collected. It did not compare 329 apartments with an empty lot. The estimates use Institute of Transportation Engineers (ITE) trip-generation rates, applied to each land use.
Why the estimated daily total falls
| Land use | Size used in 2021 study | Estimated vehicle trips / day |
|---|---|---|
| Existing fast-casual restaurant | 6,000 SF × 315.17 trips / 1,000 SF | 1,891 |
| Existing shopping-center space | 9,700 SF × 37.75 trips / 1,000 SF | 366 |
| Existing uses removed | 15,700 SF of active commercial uses | 2,257 |
| Proposed midrise apartments | 329 homes × 5.44 trips / home | 1,790 |
| Proposed retail | 6,500 SF × 37.75 trips / 1,000 SF | 245 |
| Proposed total | Residential plus a smaller retail component | 2,035 |
The removed restaurant accounts for about 84% of the old site’s estimated daily trips. Its customer turnover generates more daily trip ends in the model than all 329 proposed apartments. Replacing that use and reducing retail floor area produces the estimated 222-trip daily reduction (9.8%).
Why the peaks move in the opposite direction
| Period | Existing uses | Proposed project | Change |
|---|---|---|---|
| Morning peak hour | 22 | 125 | +103 |
| Evening peak hour | 122 | 170 | +48 |
| Entire day | 2,257 | 2,035 | −222 |
Many residents leave during the morning commute, when most of the replaced retail uses are closed. In the evening, the old commercial uses already generated trips, so the increase is smaller. The composition and timing of trips change even as their daily sum declines.
The study applied no reductions for internal capture or pass-by trips to the proposed project. Internal capture means trips between uses within the development; pass-by trips are stops by vehicles already traveling on the adjacent road. Walkability or fewer separate shopping drives may be relevant in practice, but those mechanisms do not explain the reported reduction in this calculation.
The 2021 plan also included a signal at Lemon Street / Liberty Avenue, southbound right-turn lanes, and restrictions on movements at the project driveway. These proposed roadway changes affect how traffic is handled. Their completion has not been verified in this case.
Initial Study, September 2021, Tables 4-29–4-31, pp. 4-107–4-109 [1]; revised Final Response to Comments, November 2021, pp. 1-1–1-2 [12]. The old study modeled 6,500 SF of retail; the current brochure markets 5,995 SF. The figures above preserve the original study rather than silently updating its assumptions. Totals reflect the study’s rounding. Actual traffic outcomes require later observations.
Start with the alternatives available to renters
Aspect and 770 South Harbor provide nearby examples of apartment layouts and advertised leasing terms. The public pages below support a comparison of selected floor plans; they do not supply a complete rent roll, unit mix, executed rents, or a measured vacancy rate for either community.
Selected floor plans on the communities’ own websites
| Community / plan | Bedrooms | Published floor area | Advertised monthly price | Website’s price label |
|---|---|---|---|---|
| Aspect · 1C | Studio | 716 SF | Call for details | No numerical rent displayed |
| Aspect · 1A | 1 | 726 SF | $2,556–$3,134 | Rent range |
| Aspect · 2C | 2 | 1,084 SF | $3,119–$3,962 | Rent range |
| 770 South Harbor · A1 | 1 | 615 SF | $2,918–$3,303 | Total monthly leasing price |
| 770 South Harbor · B2 | 2 | 1,043 SF | $3,449–$7,137 | Total monthly leasing price |
| 770 South Harbor · C1 | 3 | 1,212 SF | Not displayed / wait list | No numerical price displayed |
Public listing pages retrieved September 23, 2026: Aspect [8] and 770 South Harbor [9]. The retrieved Aspect brochure page displays September 14, 2026. These are dated page observations, not guaranteed current offers; websites and cached listings can differ.
A range can reflect units, move-in dates, or lease lengths. South Harbor displays 6–13-month terms. Its “total monthly leasing price” should not be pooled with Aspect’s rent label without checking included fees and matching the lease term. The high end of a range is not a representative rent for the community.
Only selected plans are shown. “Wait list” does not mean zero rent, and a count of advertised homes would not establish the property’s vacancy rate. Aspect offers studios; South Harbor’s public plan categories begin with one bedroom [8, 9].
What the regional market adds to the case
Early 2026: modest rent changes
Yardi Matrix’s April 2026 report describes mild short-term softness in advertised rents through February, alongside positive year-over-year growth and firm stabilized occupancy. It also describes an active construction pipeline [11].
Second quarter: stronger leasing
CBRE’s Q2 2026 release reports higher occupancy, stronger absorption, and rising average rents relative to the first quarter, despite additional deliveries [10].
Implication for underwriting: new supply and rising rents can coexist when demand also grows. These county-level reports cover different periods and property samples; they do not measure Atlas’s competitive segment or predict its achieved rent. The model therefore treats vacancy, concessions, and rents as scenario inputs rather than copying a market average into the project.
These short summaries use the publishers’ public releases. No subscription analytics charts, data tables, or proprietary forecasts are reproduced.
How does apartment floor area affect a rent assumption?
Use the published floor areas as reference points, then compare hypothetical monthly base rents. The round rent inputs below are teaching choices, not the communities’ reported average rents. They are not inferred from the midpoint of the advertised ranges.
| Reference plan | Public floor area | Assumed monthly base rent |
|---|---|---|
| Aspect 1C · studio | 716 SF | $2,600 |
| Aspect 1A · one bedroom | 726 SF | $2,800 |
| Aspect 2C · two bedrooms | 1,084 SF | $3,400 |
| South Harbor A1 · one bedroom | 615 SF | $3,000 |
| South Harbor B2 · two bedrooms | 1,043 SF | $3,600 |
The hypothetical model homes have 550, 800, and 1,000 SF for studios, one-bedroom, and two-bedroom apartments. Their assumed counts are 80, 150, and 99, totaling the publicly documented 329 homes. Neither these sizes nor this mix is a verified Atlas plan.
| Model apartment type | Model units / floor area | Reference examples | Unadjusted assumption / month | Adjusted assumption / month | Adjusted / SF |
|---|
Changes only the three apartment rent assumptions, rounded to whole dollars. Vacancy, concessions, affordability, costs, and financing remain separate inputs. Reloading the page resets the scenarios.
Adjustment formula and weights
Adjusted rent = assumed reference rent × (model apartment SF ÷ reference-plan SF)α × (1 + other adjustment / 100). Average available reference examples equally within each bedroom category. Weight the resulting bedroom-category rents by the model’s assumed 80 / 150 / 99 mix.
These are sensitivity assumptions, not statistically estimated coefficients. South Harbor alone supplies no studio reference; it cannot populate all three model rents. The operating pro forma separately accounts for restricted units.
Terms used in the comparison
| Term | Meaning |
|---|---|
| Units and SF | Units are apartments. SF means square feet of floor area. One published floor plan does not reveal how many apartments have that layout. |
| Asking and effective rent | Asking rent is the advertised base price. Effective rent allows for rent incentives over a stated term. Required fees must also be considered when comparing a tenant’s total cost. |
| Vacancy and availability | Vacancy concerns unoccupied apartments. Availability concerns homes offered for lease and can include occupied homes becoming available. Neither is measured here. |
| Net absorption and deliveries | Net absorption is the change in occupied units; deliveries are newly completed units. Demand can absorb new homes while rents rise. |
| Capitalization rate | Annual net operating income divided by property value. The model’s chosen cap rate is an assumption, not a quoted Atlas valuation. |
What is 5,995 square feet worth to the landlord?
Retail Insite markets divisible ground-floor retail / restaurant space under Atlas Condesa. “Divisible” does not establish a minimum suite size, approved tenant uses, or signed leases. View the broker’s listing and marketing materials [6].
For comparison, each offer leases the entire 5,995 SF. All rent and operating-expense inputs are dollars per square foot per year. Tenant improvements (TI) are a one-time landlord contribution per square foot; the leasing commission is a percentage of base rent collected over the full lease.
Compare two offers
Shared assumptions
NNN (triple net): this simplified offer reimburses all modeled operating expenses. Gross: the landlord pays those expenses from rent. In both offers, expenses continue during free base-rent months; under NNN, reimbursement continues too. Rent and expense increases occur at each lease anniversary. Payments arrive at month-end.
Landlord cash flows and value
| Measure | Offer A | Offer B |
|---|
Equivalent net annual rent converts NPV into a constant monthly payment over the same term, then multiplies by 12 and divides by 5,995 SF. It includes the upfront TI and commission. Tenant default, renewal, terminal property value, and income taxes are excluded.
How the lease NPV is calculated
- Calculate each month’s rent. First-year scheduled rent = 5,995 SF × annual rent per SF ÷ 12. Set base rent to zero during the initial free months. Apply the annual increase at months 13, 25, and so on.
- Calculate the landlord’s net receipt. Monthly cash flow = base rent collected + expense reimbursement − operating expenses.
- Discount each month to lease signing. The monthly discount rate is (1 + annual discount rate)1/12 − 1. Divide month m’s net receipt by (1 + monthly rate)m, then sum all discounted receipts.
- Deduct the upfront costs. TI = 5,995 × TI per SF. Commission = total undiscounted base rent collected × commission rate. Both are assumed paid at month 0.
| NPV reconciliation · dollars at month 0 | Offer A | Offer B |
|---|
Inspect an individual month
The discount rate is an assumed effective annual required return, not the construction-loan interest rate. This NPV values the modeled lease’s cash flows at signing; it is not a property appraisal.
Choose the retail lease for the development model
| Pro forma input or output | Selected offer | Change versus other offer |
|---|
Switching A or B immediately updates the figures above and both pro formas. The model uses the selected offer’s starting annual rent and expense recovery for stabilized retail NOI, with section 5’s retail vacancy assumption. In section 4, TI, commission, and free-rent reserves affect development cost; total cost also includes the resulting funding charges. Lease NPV is not added to the project’s capitalized value. All figures are hypothetical.
Other negotiated terms
Permitted uses, exclusivity, signage, hours, loading, parking, restaurant exhaust and grease infrastructure, delivery condition, completion dates, guarantees, assignment, and capital-repair responsibilities can change the economics. Restaurant suitability requires technical and approval review.
Construction pro forma
How much does the project cost to build, and who funds it?
Teaching strategy: build-to-rent. Develop the apartments, lease them, retain the property, and refinance construction debt with a permanent loan. This is the case’s chosen analytical framework, not a claim about the developer’s actual holding or exit plan. Section 4 budgets development; section 5 tests stabilized rental performance.
One scenario is shared by sections 4 and 5. Each preset resets both pro formas, then applies the stated change. The retail lease chosen in section 3 is retained. Edit an input to make a custom scenario.
Development assumptions
The $21 million land price is a reported transaction anchor. Editable costs, timing, rents, and financing terms are teaching assumptions; they do not establish actual project costs or financial condition.
Hard cost per apartment is an all-project proxy covering residential construction, parking, and the retail shell. Soft cost and contingency are percentages of hard cost. The lease-up allowance is a lump-sum budget reserve, not a month-by-month operating forecast.
Construction timing and borrowing
Development budget & funding
Cost detail and funding treatment
Eligible cost is the land, hard cost, soft cost, contingency, retail TI, and commission. The construction loan funds a fixed share of those items. Equity funds the remainder and all interest, loan fees, reserves, and delay overhead.
Construction loan and draw schedule
A construction loan is drawn as eligible project costs are paid. Principal is the amount borrowed and still owed. The commitment is the model’s total loan funding; the initial balance is smaller because most construction spending comes later.
How draws and interest work · inspect a month
1. Fund the project in stages
Land closes at month 0. Loan and equity fund the selected shares of each eligible cost. Construction spending follows a smooth S-curve: slower early and late, faster in the middle. Retail TI and commission are funded at completion.
2. Pay monthly interest
The assumed annual loan rate divided by 12 is applied to opening principal plus half that month’s new draw. The half-draw convention approximates spending throughout the month. Equity pays interest in cash; interest is not added to principal. No principal is repaid during construction.
3. Repay at the end
At completion, the full principal is still outstanding. Section 5 sizes a permanent loan to stabilized rental operations and shows any additional equity needed to repay construction debt. Completion and stabilization can occur at different dates; interim lease-up financing, lender covenants, and extension rights are not modeled.
Inspect a construction month
Construction principal over time
The navy line uses the base budget assumptions; the orange line uses the current construction inputs. Both use the retail lease selected in section 3. Each curve ends at its construction completion month, before any repayment.
A pause begins halfway through active construction. New construction draws stop, but outstanding debt still incurs interest and additional overhead. Both are equity-funded, so the principal line is flat during the pause. These are hypothetical model months, not verified Atlas construction dates.
Next: can rental operations support the investment?
The completed building is held for rent. Carry this development cost and outstanding loan into section 5 to test annual income, refinance capacity, and owner cash flow.
Operating performance pro forma
What does the completed rental property earn, and what remains for its owner?
Hold and rent, with no assumed sale. This pro forma describes one stabilized operating year, after initial lease-up. Capitalized value supports valuation and loan sizing; it is not sale proceeds or realized profit. The teaching model refinances only enough to repay construction debt, subject to lender limits, with no cash-out distribution.
One scenario is shared by sections 4 and 5. Each preset resets both pro formas, then applies the stated change. The retail lease chosen in section 3 is retained. Edit an input to make a custom scenario.
Rental and operating assumptions
Illustrative mix: 80 studios, 150 one-bedroom, and 99 two-bedroom apartments. This is not the verified project unit schedule. Restricted units are allocated proportionally across types in this model.
Income adjustments, restricted units, and retail vacancy
Vacancy reduces potential rent. Concessions reduce occupied base rent; other income is per occupied apartment. Restricted units use the assumed restricted rent rather than market rent. Retail income uses the lease selected in section 3.
1. Build the annual operating statement
All amounts are for one stabilized rental year, after initial lease-up. Residential operating expenses include assumed property tax, insurance, payroll, repairs, and management through one expense ratio. Retail expenses are separate. No replacement reserve or capital spending is deducted here.
2. Compare income with cost and value
Value less cost is an unrealized valuation difference, not a sale profit. A positive difference does not establish an adequate return for the time and risk involved.
3. Refinance and calculate owner cash flow
A permanent loan replaces the construction loan while the owner keeps the rental property. Its maximum capacity is the smaller of the value-based limit and the income-based limit.
How LTV, DSCR, and loan payments determine capacity
LTV (loan-to-value) caps the loan at a percentage of capitalized property value. DSCR (debt-service coverage ratio) is annual NOI divided by annual principal-and-interest payments. A 1.25× minimum requires $1.25 of NOI for each $1 of debt service.
Monthly amortization determines the payment per dollar borrowed. The annual mortgage constant is annual debt service divided by the original permanent loan amount. Divide NOI by the minimum DSCR and then by this constant to obtain the income-supported loan limit.
Refinance sources and uses
Stabilized annual cash flow to equity
Any gap between construction principal and permanent borrowing is funded by additional equity. Capacity above the construction balance is unused; there is no cash-out refinance. Completion and stabilization can occur at different dates: this screen does not model the intervening lease-up cash flows, extra carrying costs, or refinancing fees.
Sensitivity: how rent and cap rate change value less cost
Rows shift market apartment rents from the current scenario; columns change the cap rate. Restricted rent and retail income stay fixed. Each cell is an unrealized value-minus-development-cost difference in $ millions, not sale proceeds.
Calculation definitions and limits
Residential effective gross income deducts vacancy and concessions from base rent, then adds occupied-unit other income. Residential NOI deducts the expense ratio. Retail NOI adds occupied base rent and recoveries, then deducts all modeled retail expenses. Stabilized retail income uses starting contractual rent without initial free rent; the development budget separately reserves free base rent. No calendar-year rent growth is projected.
Annual cash flow to equity = NOI − permanent-loan principal-and-interest payments. Invested equity = section 4 development equity + any additional equity needed at refinance. With no cash-out, this is the cash invested basis for cash-on-cash return, not market value less debt. Principal repayments are included in debt service; no extra deduction is made for them.
This is a build-to-rent feasibility screen, not a multi-year investment return forecast or the sponsor’s underwriting. It excludes recurring replacement reserves, capital spending, refinancing fees, tax effects, pre-acquisition carrying costs, and a detailed lease-up schedule. Cash flow and cash-on-cash are therefore before those items; there is no terminal sale or project IRR.
Sources and modeling choices
The factual project narrative uses city records, the developer’s announcement, transaction reporting, and the broker’s public listing. Nearby floor-plan observations come from the communities’ own websites. Regional context is summarized from public market releases.
Financial terms, reference rents used in the calculator, and the model’s apartment mix and sizes are explicit teaching assumptions. They do not reveal actual Atlas costs, financing, signed leases, or investment returns.
Site visual and scope
The embedded site schematic is an original teaching diagram based on the location and broad land-use relationships shown in the city’s 2021 initial study. It remains available with this page. It is not a survey, architectural drawing, exact parcel outline, final floor plan, or depiction of completed construction.
The two broker conceptual renderings are locally preserved copies from Retail Insite’s public Atlas Condesa listing [6], retrieved September 27, 2026. They illustrate marketed building form and amenities, not completed construction. The original image files and their “Conceptual Rendering” labels are unchanged. The listing does not identify the production method; the case does not characterize these images as AI-generated.
The developer and broker may revise plans and delivery targets. Public rental listings may change with the selected unit, lease term, and move-in date. This case is a dated teaching snapshot rather than a continuously updated listing service.
Only original explanatory content and code are covered by the course collection’s applicable reuse terms. Third-party images, publications, and linked materials retain their own rights; links do not imply affiliation or endorsement.